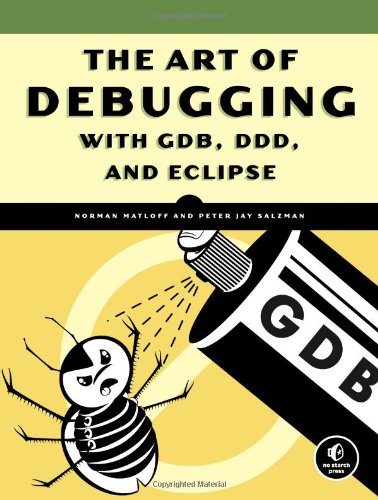
The Art of Debugging with GDB DDD and Eclipse 1st Edition by Norman Matloff, Peter Jay Salzman ISBN 978-1593272319 1593272319
$50.00 Original price was: $50.00.$35.00Current price is: $35.00.
The Art of Debugging with GDB DDD and Eclipse 1st Edition by Norman Matloff, Peter Jay Salzman – Ebook PDF Instant Download/Delivery: 978-1593272319, 1593272319
Full download The Art of Debugging with GDB DDD and Eclipse 1st Edition after payment

Product details:
ISBN 10: 1593272319
ISBN 13: 978-1593272319
Author: Norman Matloff, Peter Jay Salzman
Debugging is crucial to successful software development, but even many experienced programmers find it challenging. Sophisticated debugging tools are available, yet it may be difficult to determine which features are useful in which situations. The Art of Debugging is your guide to making the debugging process more efficient and effective.
The Art of Debugging illustrates the use three of the most popular debugging tools on Linux/Unix platforms: GDB, DDD, and Eclipse. The text-command based GDB (the GNU Project Debugger) is included with most distributions. DDD is a popular GUI front end for GDB, while Eclipse provides a complete integrated development environment.
In addition to offering specific advice for debugging with each tool, authors Norm Matloff and Pete Salzman cover general strategies for improving the process of finding and fixing coding errors, including how to:
–Inspect variables and data structures
–Understand segmentation faults and core dumps
–Know why your program crashes or throws exceptions
–Use features like catchpoints, convenience variables, and artificial arrays
–Avoid common debugging pitfalls
Real world examples of coding errors help to clarify the authors’ guiding principles, and coverage of complex topics like thread, client-server, GUI, and parallel programming debugging will make you even more proficient. You’ll also learn how to prevent errors in the first place with text editors, compilers, error reporting, and static code checkers.
Whether you dread the thought of debugging your programs or simply want to improve your current debugging efforts, you’ll find a valuable ally in The Art of Debugging.
Table of contents:
1. SOME PRELIMINARIES FOR BEGINNERS AND PROS
Programming Language Focus
The Principles of Debugging
Text-Based vs. GUI-Based Debugging Tools, and a Compromise Between Them
Main Debugger Operations
Online Help
Introductory Debugging Session
Use of Startup Files
2. STOPPING TO TAKE A LOOK AROUND
Overview of Breakpoints
Keeping Track of Breakpoints
Setting Breakpoints
Extended GDB Example
Persistence of Breakpoints
Deleting and Disabling Breakpoints
More on Viewing Breakpoint Attributes
Resuming Execution
Conditional Breakpoints
Breakpoint Command Lists
Watchpoints
3. INSPECTING AND SETTING VARIABLES
Advanced Inspection and Setting of Variables
Setting Variables from Within GDB/DDD/Eclipse
GDB’s Own Variables
4. WHEN A PROGRAM CRASHES
Core Files
Extended Example
5. DEBUGGING IN A MULTIPLE-ACTIVITIES CONTEXT
Debugging Threaded Code
Debugging Parallel Applications
Extended Example
6. SPECIAL TOPICS
Debugging GUI Programs
7. OTHER TOOLS
Making Good Use of the Compiler
Error Reporting in C
Better Living with strace and Itrace
Static Code Checkers: lint and Friends
Debugging Dynamically Allocated Memory
8. USING GDB/DDD/ECLIPSE FOR OTHER LANGUAGES
Perl
Python
Debugging SWIG Code
Assembly Language
COLOPHON
People also search for:
the art of debugging with gdb ddd and eclipse
gdb advanced debugging tips
the gdb developer’s gnu debugger tutorial
art of debugging pdf
gdb debug process
Tags: Norman Matloff, Peter Jay Salzman, The Art, Debugging with GDB


